Where we are
We are a global company
Headquartered in London, UK, with clients around the globe.
Where we are
Headquartered in London, UK, with clients around the globe.
Social housing reporting
The system-based Tenant Satisfaction Measures calculated automatically from your housing, repairs, compliance and complaints data, the tenant survey run alongside, and Awaab’s Law deadlines tracked. Monthly, in Power BI, inside your own Microsoft tenant.
Ten of the 22 measures come from data you already hold. The work is getting it out of four or five systems, the same way, every year.
Every spring someone pulls extracts from the housing, repairs, compliance and complaints systems and rebuilds the system-based measures by hand.
Which homes count, what counts as a stage two complaint, whether a repair met its target. The answer changes with whoever built last year’s workbook.
By the time the figures reach the board, the year is over and there is nothing left to fix.
The survey supplier sends results in its own format, and they never sit next to the repairs and complaints data that explain them.
Awaab’s Law deadlines live across the repairs system, emails and surveyors’ diaries, so a breach is often spotted after it happens.
The method lives in one person’s head and a folder of formulas.
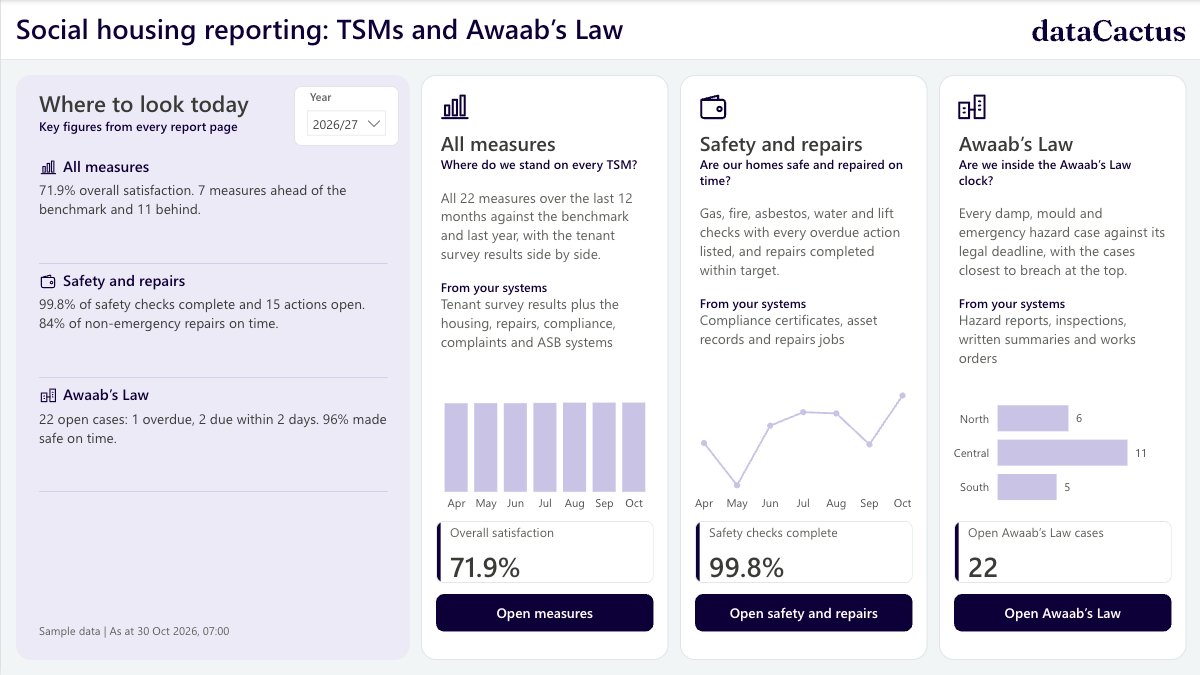
All measures
Every TSM calculated over a rolling 12 months, next to the benchmark and last year, so you know where the return will land long before year end.
Safety and repairs
Gas, fire, asbestos, water and lift checks with the homes and buildings behind every gap, and repairs completed within target by month.
Awaab’s Law
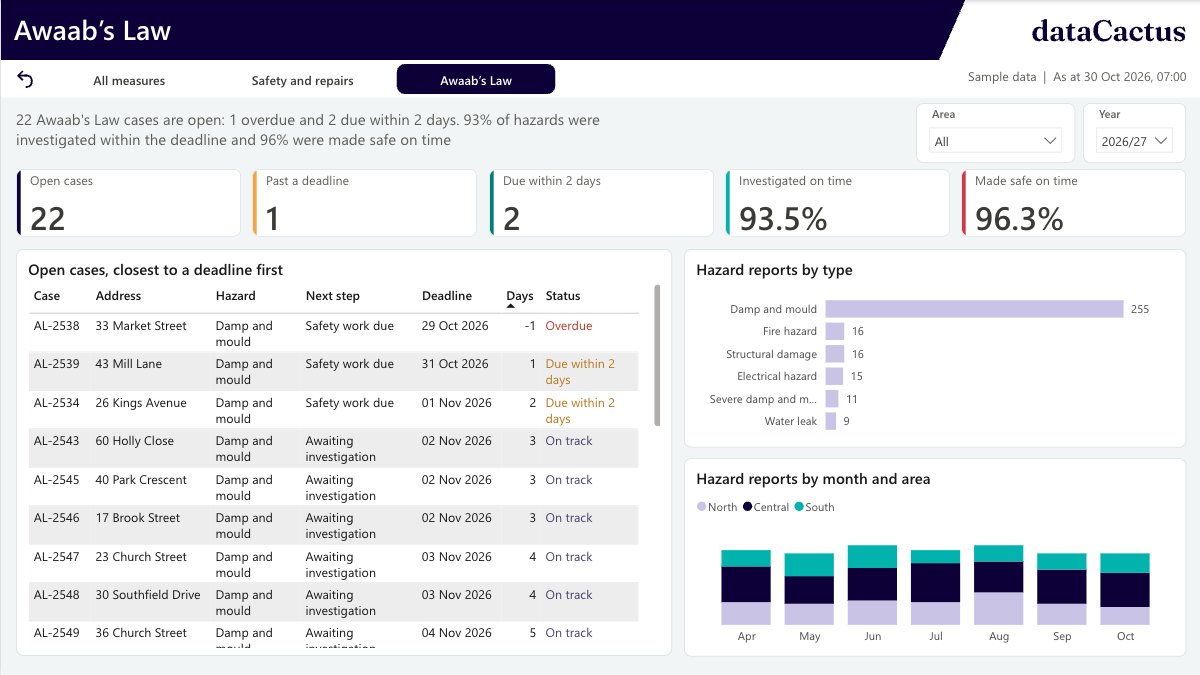
Every damp, mould and emergency hazard case against its legal deadline, with the cases closest to breach at the top of the list.
Tenant survey
The 12 perception measures come from a survey with fixed questions, minimum sample sizes and a published method. We run it on your own Microsoft 365, so the results land in the same report as everything else.
Talk about your surveyA monthly view of every measure, so the board sees the trend while there is still time to act.
Figures worked out from the definitions in the regulator’s requirements, ready to copy into the annual return.
A table of your results against last year, laid out the way tenants expect to read it on your website.
Every figure traces back to the records and rules that produced it, which is what internal audit asks for.
A working report on sample data for Northbridge Homes, a landlord with 6,250 homes in three areas. Change the area or year, or click any chart to filter the page.
 Open the live report
We read from your systems as they are. No new software for your teams, and no changes to how they record their work.
Civica Cx, NEC Housing, MRI Housing, Aareon QL and similar systems for homes, tenancies and anti-social behaviour cases.
Your repairs or job management system, including contractor portals and works orders.
Gas, fire, asbestos, water and lift records from your compliance system or contractor certificates.
Your complaints log, wherever it lives, mapped to stage one and stage two.
Run on your Microsoft 365 by email, SMS and telephone, or result files from your current survey supplier.
Read-only access to the systems that hold your data. Nothing changes in how your teams work.
We agree your definitions with you, line by line, and build them into the model so they stop moving each year.
Power BI reports in Teams or the browser, refreshed automatically, inside your own Microsoft tenant.
Send us last year’s return and tell us which systems you use. We show you which measures we can automate and where your definitions need a closer look.
Landlords with 1,000 or more homes submit them to the Regulator of Social Housing every year. Every registered landlord publishes them.
Bring last year’s TSM return.
We will show you which measures can come straight from your systems, the survey included, and what it takes to get there.
We use Google Analytics to see which pages are useful. No advertising. Cookies are only set if you accept; otherwise we count anonymous, cookie-free visits only.