Where we are
We are a global company
Headquartered in London, UK, with clients around the globe.
Where we are
Headquartered in London, UK, with clients around the globe.
Sage X3 reporting
Management accounts, sales, stock and production reporting from Sage X3 across every company and site, refreshed automatically and unaffected by upgrades.
Inquiries and Crystal reports handle the day-to-day well. Management reporting across companies, sites and teams is where it gets slow, fragile and dependent on specialists.
Crystal reports are tied to X3’s database. When X3 is upgraded, custom reports can stop working and need a developer to fix.
Joining X3’s tables correctly takes knowledge most finance and operations teams do not have, so requests queue up.
Sales, stock and production figures are pulled separately by each team, and month end starts with reconciling them.
Group figures across companies, sites and currencies are assembled in Excel after each close.
People running warehouses, plants and sales teams get a spreadsheet instead of looking at their own numbers.
Inquiries over several years of transactions are slow to run in the live system, so trends are rarely looked at.
Five report pages, set up around your companies, sites and product structure. We walk you through them on sample data first, then on your own.
Profit and loss and balance sheet by company, site and department, against budget and last year, in your group currency.
Revenue and margin by customer, product, site and sales rep, with the orders still to ship next to what has been invoiced.
Stock value and cover by site, slow movers, purchase orders due and supplier delivery performance.
Work orders, output against plan and the cost of production compared with standard, for manufacturers running X3.
Debtors, creditors and stock together, with days to get paid and to pay, across every company.
Book a reporting review
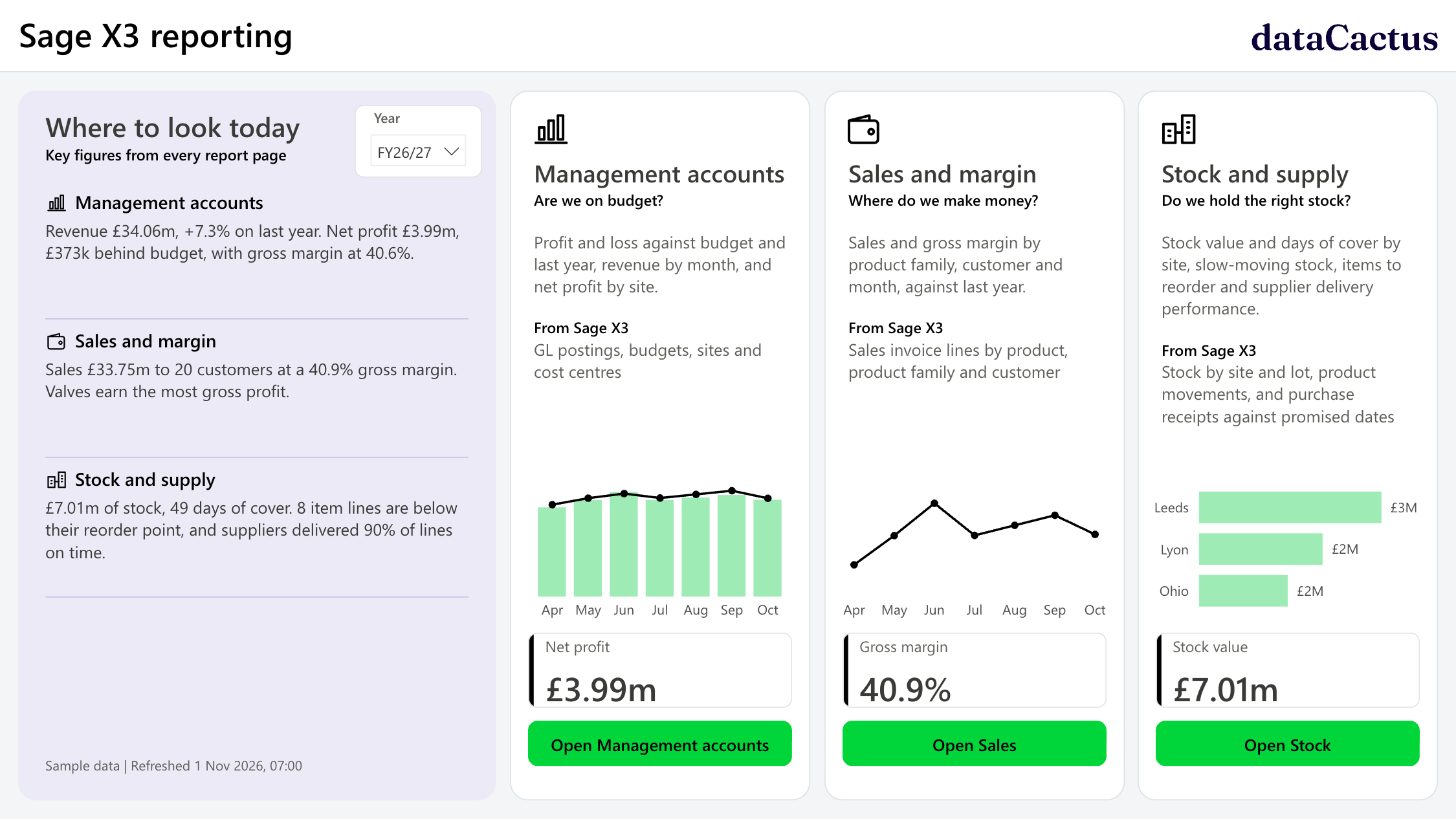
A working Sage X3 report on sample data for three sites in Leeds, Lyon and Ohio. Change the year or site, or click any bar to filter the rest of the page.
 Open the live report
A read-only connection to the X3 database. Nothing changes in how your teams run X3, and no screens or reports in X3 are altered.
We bring finance, sales, purchasing, stock and production into one model with shared definitions, kept in your own Microsoft tenant.
Power BI reports in Teams or the browser, refreshed automatically. Because they sit outside X3, an X3 upgrade does not break them.
Sales, stock, purchasing and production sit next to the ledger with shared definitions, so month end starts with answers rather than reconciliations.
Nothing changes in how your teams work in X3. The reports only read the data.
Finance teams trust reports only when the numbers tie back to the ledger. Every report we build is reconciled to the source before anyone relies on it.
Financial services
Profit and loss, balance sheet, KPI and reconciliation reporting moved from a legacy BI tool to Power BI on a proper data model, with two reporting bases and manual-adjustment capability preserved.
Read the case study
We will show you what it looks like built on live Sage X3 data, and what it would take to get there.
Talk about X3 reporting