Where we are
We are a global company
Headquartered in London, UK, with clients around the globe.
Where we are
Headquartered in London, UK, with clients around the globe.
Sage 200 reporting
Management accounts, group consolidation and cash reporting from Sage 200 Standard or Professional, refreshed automatically. No more exporting to Excel.
Report Designer handles the standard reports and documents well, and Excel Integrated Reporting suits finance people who think in spreadsheets. As the business grows, the questions outgrow them.
Figures are exported to Excel, tidied and pasted into the month-end pack. By the time anyone reads it, it is already out of date.
Bringing subsidiaries together means exporting trial balances and lining up the accounts by hand, every month.
Budget against actual and the cash forecast live in separate workbooks that one person understands.
Orders and pipeline sit in the CRM, jobs in another system, headcount in payroll. Sage 200 sees the ledger, not the business.
Managers without a Sage login wait for a PDF instead of looking at their own numbers when they need them.
Adding a column or a new view means Report Designer skills or a paid report design request.
Five report pages, set up around your chart of accounts, departments and companies. We walk you through them on sample data first, then on your own.
Profit and loss against budget and last year, by department and cost centre, with a click through to the transactions behind any number.
All your Sage 200 companies in one set of accounts, including different currencies and year ends, with intercompany shown separately.
Aged debtors and creditors over time, days to get paid and to pay, and a rolling 13-week cash view.
Revenue and margin by customer, product and region, joined to your CRM pipeline when you want to see what is coming as well as what has been invoiced.
Stock value by warehouse, slow movers and weeks of cover, so purchasing and finance work from the same figures.
Book a reporting review
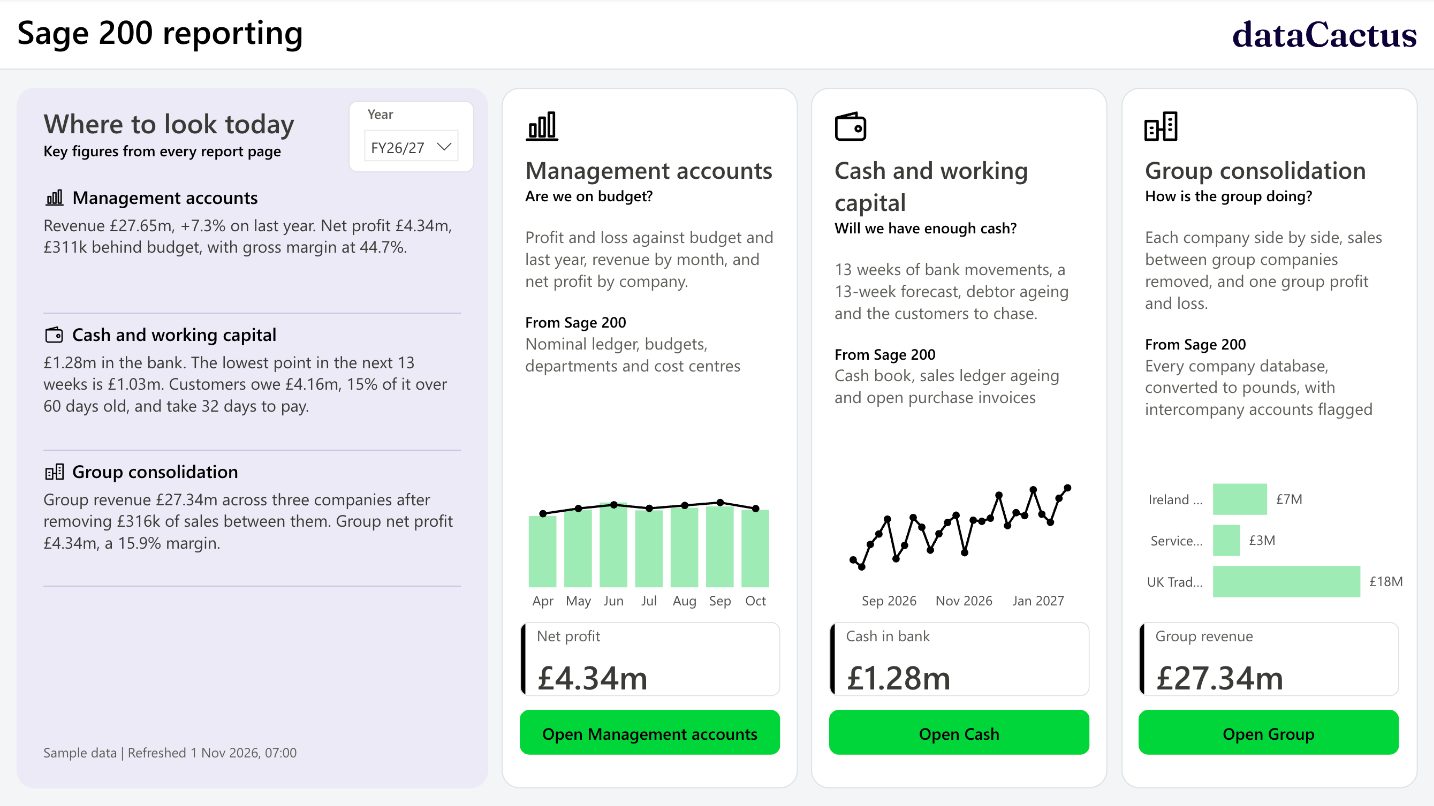
A working Sage 200 report on sample data for a three-company group. Change the year or company, or click any bar to filter the rest of the page.
 Open the live report
A read-only connection to Sage 200. Nothing changes in how your team posts, closes or runs Sage day to day.
The figures land in a database in your own Microsoft tenant and keep their history, so you can compare any month with any other.
Power BI reports in Teams or the browser, refreshed automatically. Finance can still work in Excel, connected to the same numbers.
Your data sits in your own SQL Server database. We connect with a read-only login, so nothing in Sage can be changed, and copy the figures into Azure on a schedule.
Your data is hosted by Sage, so there is no direct database access. We read it through the Sage 200 API and load it into Azure on a schedule, so refreshes never depend on a computer being left switched on.
The same reports work from Sage 50, and they carry over when you move up to Sage 200.
Finance teams trust reports only when the numbers tie back to the ledger. Every report we build is reconciled to the source before anyone relies on it.
Financial services
Profit and loss, balance sheet, KPI and reconciliation reporting moved from a legacy BI tool to Power BI on a proper data model, with two reporting bases and manual-adjustment capability preserved.
Read the case study
We will show you what it looks like built on live Sage 200 data, and what it would take to get there.
Talk about Sage reporting