Where we are
We are a global company
Headquartered in London, UK, with clients around the globe.
Where we are
Headquartered in London, UK, with clients around the globe.
Sage 50 reporting
Management accounts, group and cash reporting from Sage 50, without slow reports or monthly CSV exports.
Sage 50 has a large library of standard reports and a designer for changing layouts. Once there is more than one company, a budget to track or a board to report to, most of the work moves into spreadsheets.
Sage 50 keeps its data in its own files rather than a database other tools read easily, so reporting usually starts with a CSV export.
As the years of transactions build up, big reports take longer to run, and some stop with memory errors.
The built-in consolidation cannot combine companies with different currencies or financial year starts, so the group pack is built in Excel.
The monthly management accounts are exported, formatted and checked by one person, and wait for them to be free.
Set up around your nominal codes, departments and companies. We walk you through them on sample data first, then on your own.
Profit and loss against budget and last year, by department, with a click through to the transactions behind any figure.
All your Sage 50 companies together, including different currencies and year ends.
Who owes what and for how long, how that is changing month by month, and the cash you can expect over the coming weeks.
Revenue and margin by customer and product, compared with any earlier period.
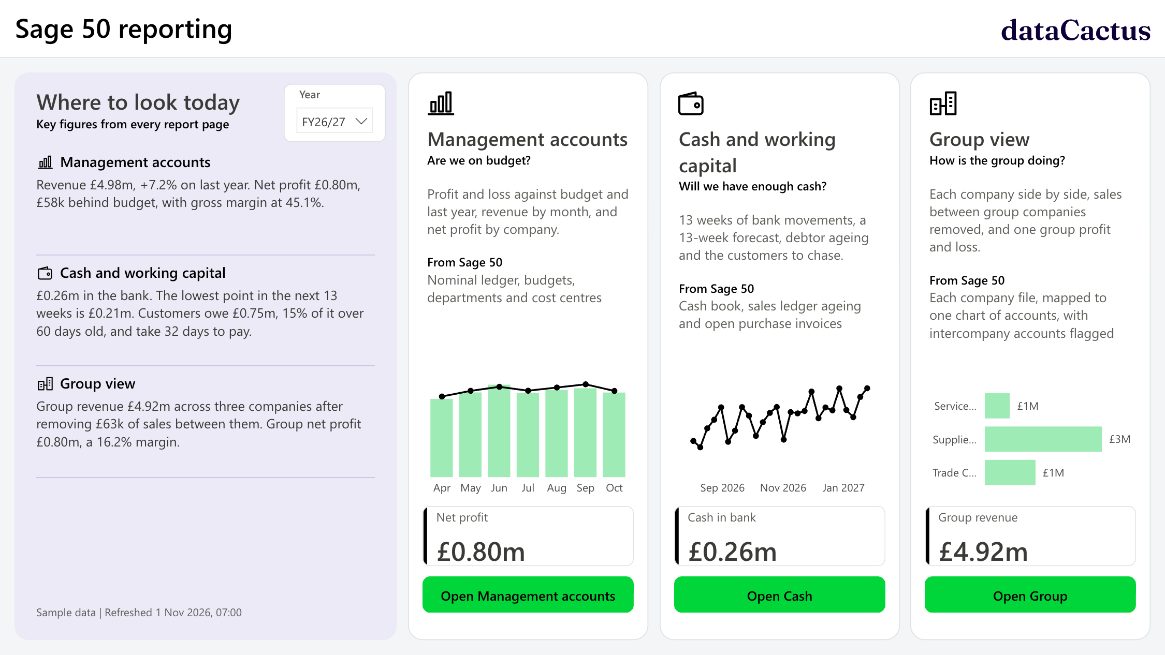
A working Sage 50 report on sample data for three companies. Change the year or company, or click any bar to filter the rest of the page.
 Open the live report
Sage 50 comes with a data driver that lets approved tools read your accounts. We use it to read the data on a schedule, outside working hours, so Sage is not slowed down.
The figures are copied into a database in your own Microsoft tenant, where they keep their history and reports run quickly however many years you hold.
Power BI reports in Teams or the browser, refreshed automatically, with the option to keep working in Excel on the same numbers.
Nothing changes in how your team posts and closes in Sage 50. The reports only read the data.
When you move up to Sage 200 or another accounts system, the reports carry over. See Sage 200 reporting.
We will show you what it looks like built on live Sage 50 data, and what it would take to get there.
Talk about Sage reporting