Where we are
We are a global company
Headquartered in London, UK, with clients around the globe.
Where we are
Headquartered in London, UK, with clients around the globe.
Sage Intacct reporting
Board packs, fund and grant reporting and budget holder views from Sage Intacct, refreshed automatically across every entity and dimension.
Sage Intacct’s dashboards, dimensions and report writers are among the best in its class. The gaps appear when the numbers have to leave Intacct: for the board, for funders, for budget holders, or next to data from other systems.
Power BI has no built-in connection to Sage Intacct, so most teams start with exports or a third-party driver that someone has to look after.
Board and funder packs start in Intacct and end in a spreadsheet, rebuilt by hand every month.
Wide reports across many dimensions can take a long time to run or time out, and Excel exports stop at 65,000 rows.
Department heads and project leads without an Intacct login rely on finance to send them their figures.
Fundraising, CRM, payroll and grant data sit outside Intacct, so the full picture is assembled by hand.
Intacct’s dimensions are powerful, but building new reports takes skills most finance teams do not have time to learn.
Five report pages, set up around your entities, dimensions and funds. We walk you through them on sample data first, then on your own.
Income, expenditure and balance sheet by entity, department and location, against budget and last year, ready for the board without retyping.
Restricted and unrestricted funds, grant spend against budget, and grants nearing their end date, for trustees and funders.
Each department or project lead sees their own spend against budget, with the transactions behind it, and nothing else.
All your Intacct entities together, with intercompany shown separately and currencies translated to your reporting currency.
Who owes what and for how long, supplier payments due, and the cash position across entities over the coming weeks.
Book a reporting review
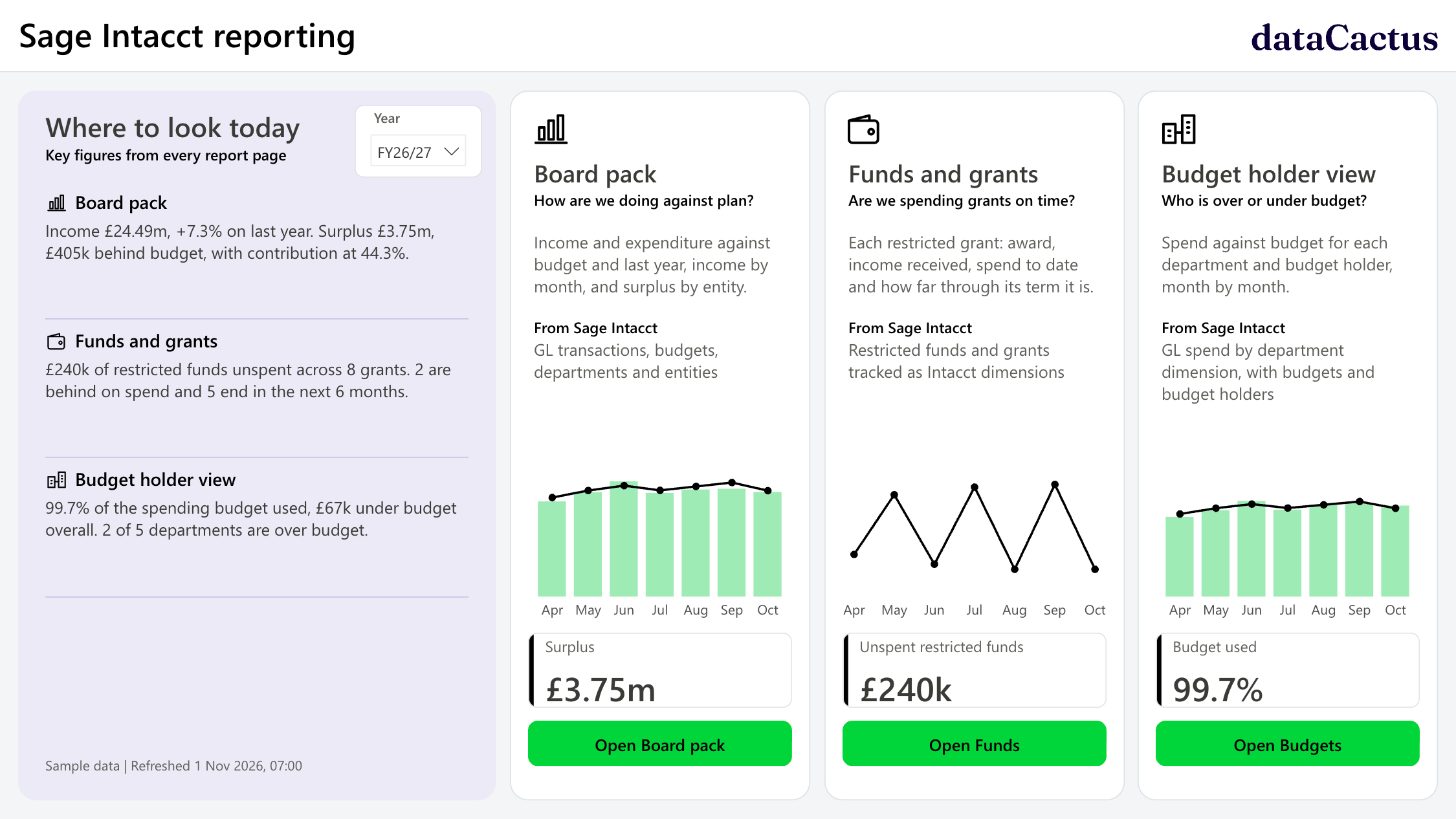
A working Sage Intacct report on sample data for a charity group with restricted grants. Change the year, entity or department, or click any bar to filter the rest of the page.
 Open the live report
We read your data through the Sage Intacct API or its scheduled data exports, loading only what has changed so you stay well within your API allowance.
The figures land in a database in your own Microsoft tenant with every dimension you use, and keep their history for any comparison you need.
Power BI reports in Teams or the browser, refreshed automatically. Finance can still work in Excel on the same numbers.
Funds, grants and restrictions reported alongside the ledger, ready for trustees and funders. Our work with charities.
Nothing changes in how your team posts and closes in Intacct. The reports only read the data.
Finance teams trust reports only when the numbers tie back to the ledger. Every report we build is reconciled to the source before anyone relies on it.
Financial services
Profit and loss, balance sheet, KPI and reconciliation reporting moved from a legacy BI tool to Power BI on a proper data model, with two reporting bases and manual-adjustment capability preserved.
Read the case study
We will show you what it looks like built on live Sage Intacct data, and what it would take to get there.
Talk about Intacct reporting