Where we are
We are a global company
Headquartered in London, UK, with clients around the globe.
Where we are
Headquartered in London, UK, with clients around the globe.
NetSuite reporting
Management accounts, group reporting across subsidiaries, revenue and cash from NetSuite, with reports that refresh quickly and agree with each other.
NetSuite’s dashboards and saved searches are good for live, single-question views. Reporting across subsidiaries, years and other systems is where it gets slow and inconsistent.
Connecting Power BI straight to NetSuite is slow. Refreshes take a long time or fail, so reports are rarely as current as they should be.
Every team builds its own saved searches, and before long the same figure looks different depending on where you read it.
Reports have row limits and very large results may not export, so the full history ends up split across files.
Group reporting across subsidiaries and currencies gets complicated quickly, and the board pack is finished in Excel.
NetSuite holds hundreds of record types. Working out which ones to use, and how they join, takes weeks without experience.
E-commerce, CRM, payroll and warehouse data often sit outside NetSuite, so the full picture is pieced together by hand.
Five report pages, set up around your subsidiaries, departments, classes and locations. We walk you through them on sample data first, then on your own.
Profit and loss and balance sheet by subsidiary, department, class and location, against budget and last year.
All subsidiaries in your group currency, with intercompany shown separately, ready for the board.
Revenue and margin by customer, item and channel, with billing still to come next to what has been invoiced.
Debtors, creditors and the cash position across subsidiaries, with days to get paid and to pay over time.
Stock value and cover by location, orders waiting to ship and supplier delivery performance, for businesses holding stock in NetSuite.
Book a reporting review
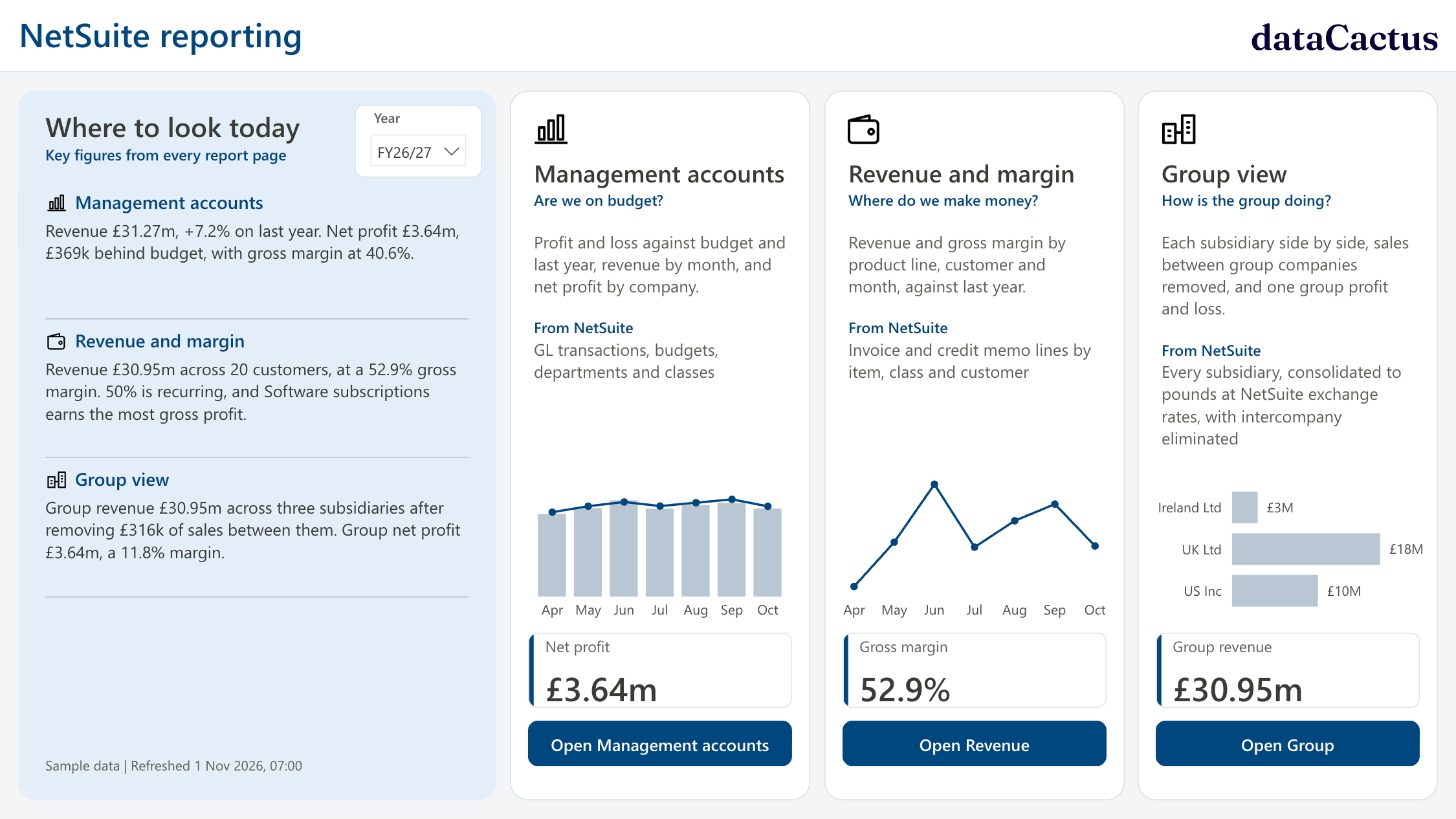
A working NetSuite report on sample data for three subsidiaries in the UK, US and Ireland. Change the year or subsidiary, or click any bar to filter the rest of the page.
 Open the live report
We pull data through SuiteAnalytics Connect or the NetSuite API, loading only what has changed and doing the heavy joining afterwards, so extracts are quick and NetSuite is not slowed down.
Finance, sales and stock come together in one model with shared definitions, stored in your own Microsoft tenant with full history.
Power BI reports in Teams or the browser that refresh quickly and reliably. Finance can still work in Excel on the same numbers.
Finance, sales and stock share one set of definitions, so the figure in the board pack matches the one in the sales report.
Nothing changes in how your teams work in NetSuite. The reports only read the data.
Finance teams trust reports only when the numbers tie back to the ledger. Every report we build is reconciled to the source before anyone relies on it.
Financial services
Profit and loss, balance sheet, KPI and reconciliation reporting moved from a legacy BI tool to Power BI on a proper data model, with two reporting bases and manual-adjustment capability preserved.
Read the case study
We will show you what it looks like built on live NetSuite data, and what it would take to get there.
Talk about NetSuite reporting