Where we are
We are a global company
Headquartered in London, UK, with clients around the globe.
Where we are
Headquartered in London, UK, with clients around the globe.
RingCentral reporting
Calls, answer rate, service level by queue and hour, and agent reporting from RingCentral, refreshed automatically and kept for as long as you need.
RingCentral’s analytics answer the questions about this week well. As call volumes grow, the questions are about trends, staffing and the customers behind the calls.
Performance reports go back about six months and the call log about a year, so comparing this winter with last winter needs your own copy of the data.
RingCentral’s analytics and its call log come from different sources, so the same day can show different totals depending on where you look.
Measures such as the share of calls answered within 20 seconds, by queue and hour, are regular requests on RingCentral’s ideas forum.
Scheduled reports arrive one subscription at a time, so the weekly pack is still put together by hand.
Call data is not joined to the CRM or support desk, so you cannot see which customers wait longest or what missed calls cost.
The call log API sits in RingCentral’s heavy usage group and new calls take a few seconds to appear, so a reliable copy needs a scheduled, rate-aware sync.
Five report pages, set up around your queues, sites and teams. Try the first three on sample data below, then see them on your own.
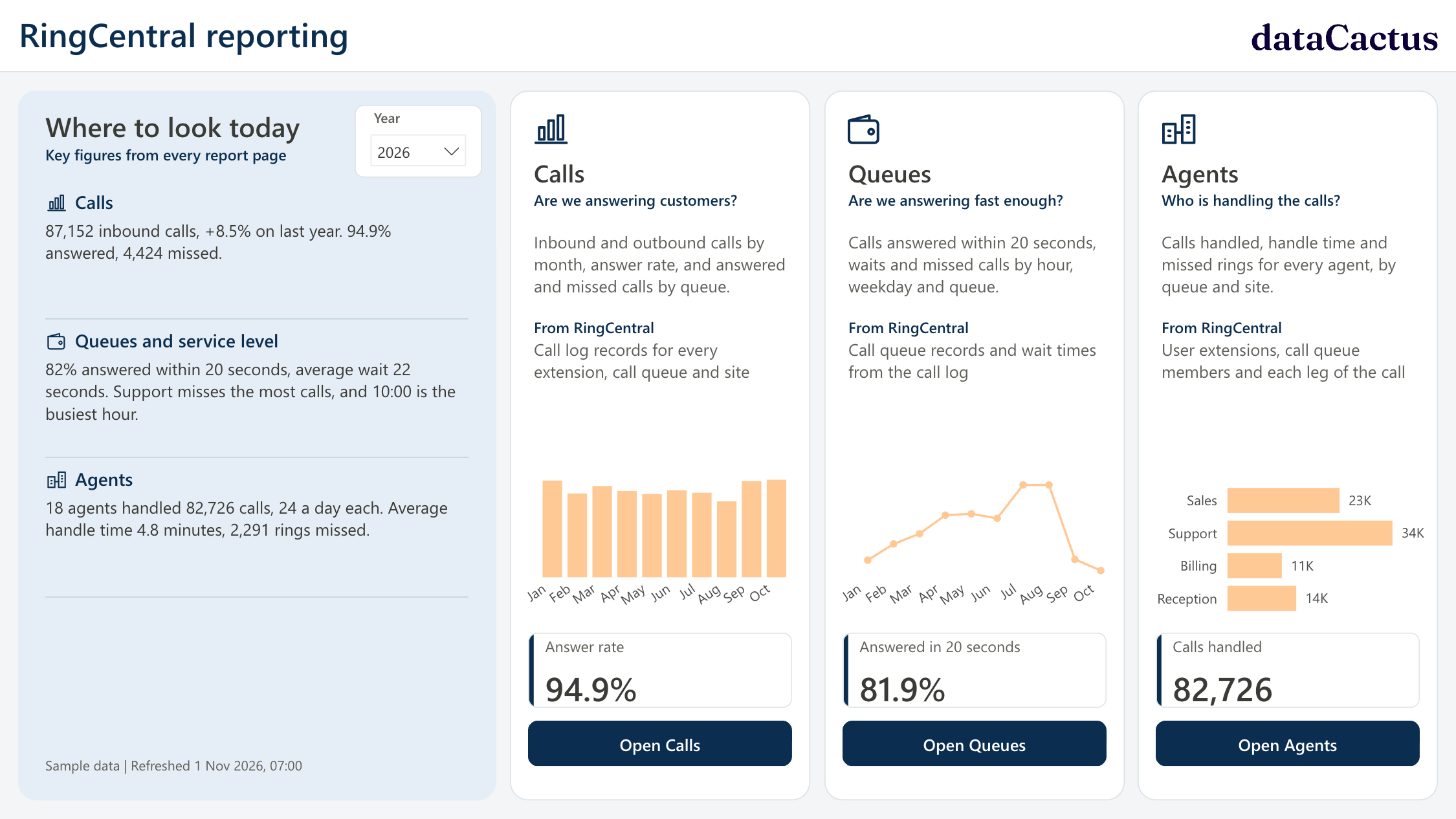
Inbound and outbound calls by month, answer rate, and answered and missed calls by queue and site, compared with last year.
Calls answered within 20 seconds, waits and missed calls by hour, weekday and queue, so you staff the busy hours.
Calls handled, calls a day, handle time and missed rings for every agent, by queue and site.
Every missed caller who did not get through later, with the number, queue and time, ready for a call-back list.
Calls joined to your CRM or support desk, so wait times and missed calls show by customer and account value.
Book a reporting review
A working RingCentral report on sample data for two sites and four queues. Change the year or site, or click any bar to filter the rest of the page.
 Open the live report
A RingCentral app with read-only call log access, approved by your RingCentral admin. Nothing in your phone system can be changed.
Every call log record is copied to a database in your own Microsoft tenant on a schedule, and kept for as long as you need, not just six or twelve months.
Power BI reports in Teams or the browser, refreshed automatically, with row-level security so team leaders see their own queues.
We load whatever history RingCentral still holds, then keep every new call, so year-on-year comparisons work from the second year onwards.
Every figure is built from the detailed call log, so the totals on each page agree with each other, and we explain any gap with RingCentral’s own analytics.
Call reporting is only useful when team leaders trust the numbers. Every report we build is checked against the phone system before anyone relies on it.
Manufacturing
Call data from five separate 3CX phone systems is pulled into one Azure data warehouse and reported in Power BI, replacing around ten hours a month of manual collection.
Read the case study
We will show you what it looks like built on live RingCentral data, and what it would take to get there.
Talk about RingCentral reporting