Where we are
We are a global company
Headquartered in London, UK, with clients around the globe.
Where we are
Headquartered in London, UK, with clients around the globe.
HiBob reporting
Headcount over time, turnover, hiring and absence from HiBob, refreshed automatically and joined to payroll and finance. No more exporting Bob reports to Excel.
Bob’s reports and dashboards answer the questions about today well. As the business grows, the questions are about trends, cost and the rest of the business.
Bob shows who works here today. Seeing how headcount moved month by month means running history reports and stitching them together.
Leavers are exported, joined to headcount in Excel and the turnover maths done by hand, every month and for every board pack.
Some figures sit in analytics, some in dashboards, some in time off. Reports can be slow to load and fiddly to change.
Cost per head, overtime and hiring spend need payroll, finance and recruitment figures that Bob does not hold.
Days off are recorded, but spotting repeat short absences or comparing teams means more exporting and more formulas.
Teams that try the API on their own run into service user permissions, separate history tables and custom fields that arrive as codes.
Five report pages, set up around your departments, sites and custom fields. Try the first four on sample data below, then see them on your own.
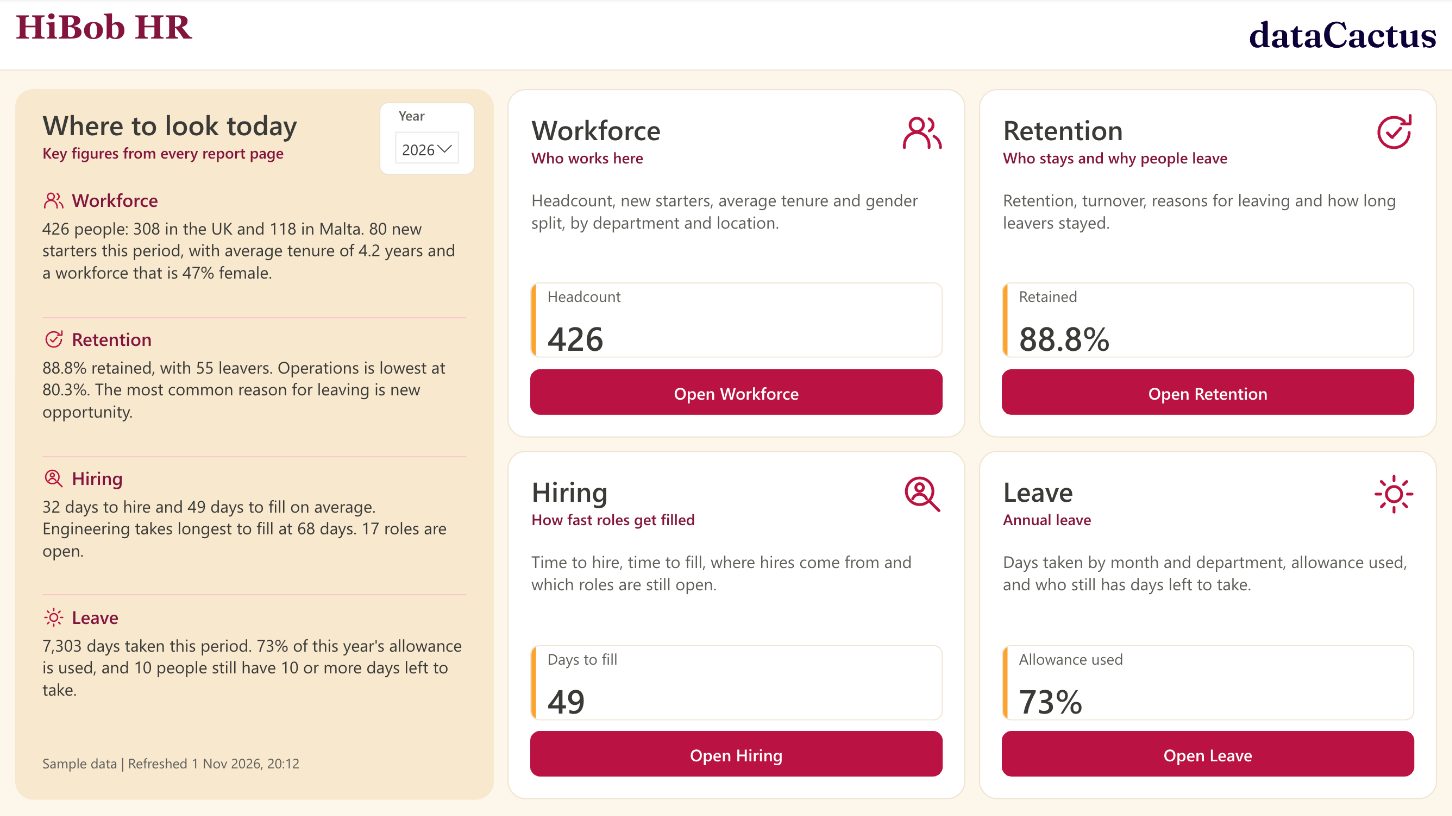
Headcount, starters and leavers over time by department, location and employment type, with tenure and gender split.
Turnover and retention by team, reasons for leaving and how long leavers stayed, so you see where people are not staying.
Time to hire and time to fill, open roles, where hires come from and which teams take longest to fill.
Days taken by month and team, allowance used, people with days left to take, and repeat short absences.
Bob joined to payroll and the finance ledger, so headcount, salary cost and budget sit in one view.
Book a reporting review
A working HiBob report on sample data for a 426-person company in two countries. Change the year or location, or click any bar to filter the rest of the page.
 Open the live report
A read-only service user in Bob, set up by your Bob admin with exactly the fields the reports need. Nothing in Bob can be changed.
People, work history, time off and hiring data land in a database in your own Microsoft tenant, with history kept so every month can be compared.
Power BI reports in Teams or the browser, refreshed automatically, with row-level security so managers see their own teams only.
We load Bob’s work, salary and lifecycle history tables, so headcount and turnover are correct for any past month, including changes with a back-dated effective date.
Your custom fields and lists are mapped once to their proper names, so reports read “Cost centre: Operations” instead of a long number.
People data is only useful when HR trusts the numbers. Every report we build is checked against the source system before anyone relies on it.
Charities & care
Fortnightly manual extracts from the HR and payroll systems became automatic daily updates into one organised set of figures, with each manager seeing only their own teams.
Read the case study
We will show you what it looks like built on live HiBob data, and what it would take to get there.
Talk about HiBob reporting